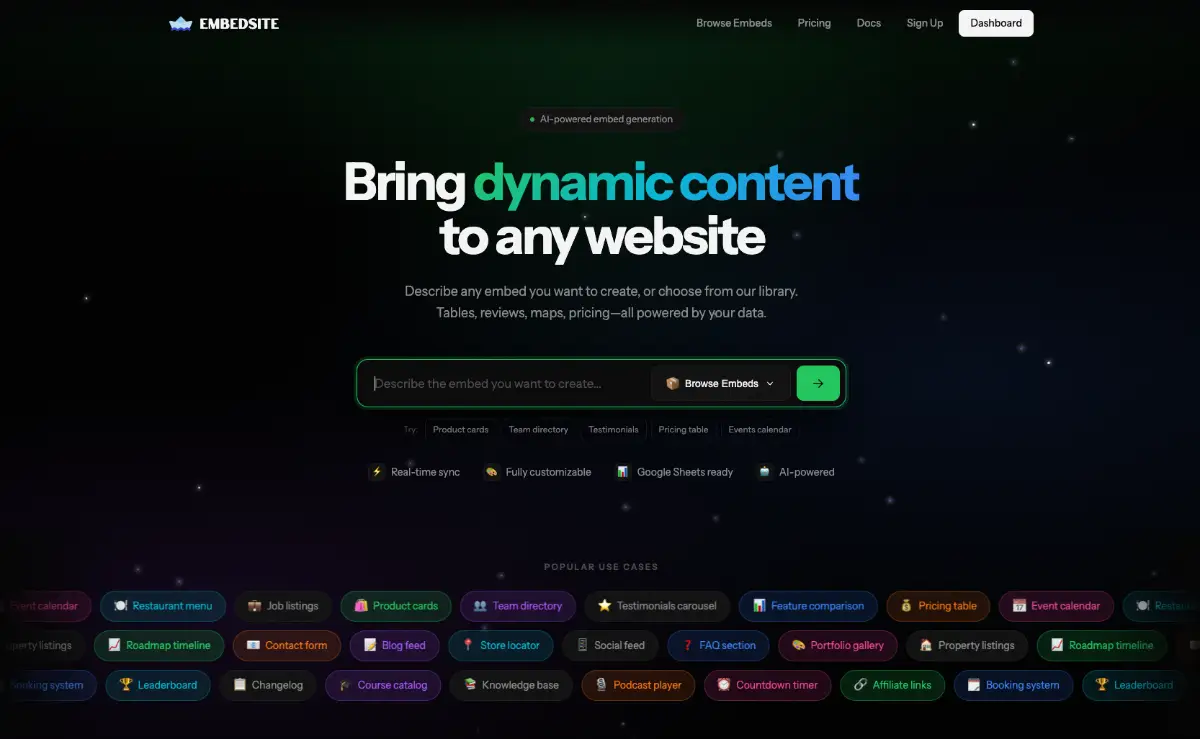
EmbedSite lets you create interactive data visualizations and embed them anywhere with a simple script tag.
You upload your data or connect to a source, choose from charts, maps, tables, or custom components, and get a shareable embed code. The widgets are responsive, update automatically when your data changes, and work across any platform, such as blogs, docs, internal tools, client dashboards.
No backend required, though we can reuse your existing one such as a Google Sheet or database. No complex integrations. Just clean visualizations that work.
The goal is simple.
Make data visualization embeds as easy to add as a YouTube video.
Features
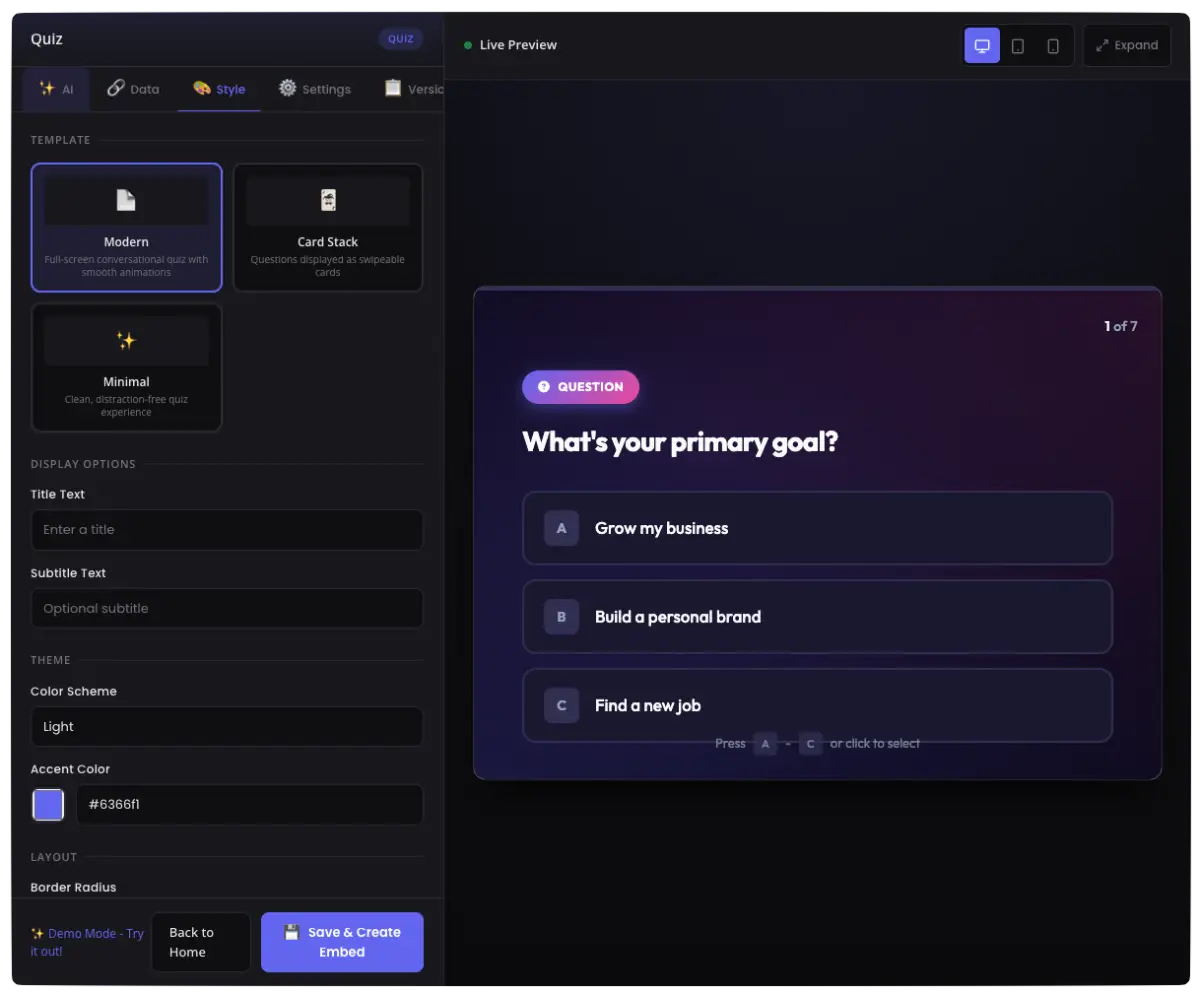
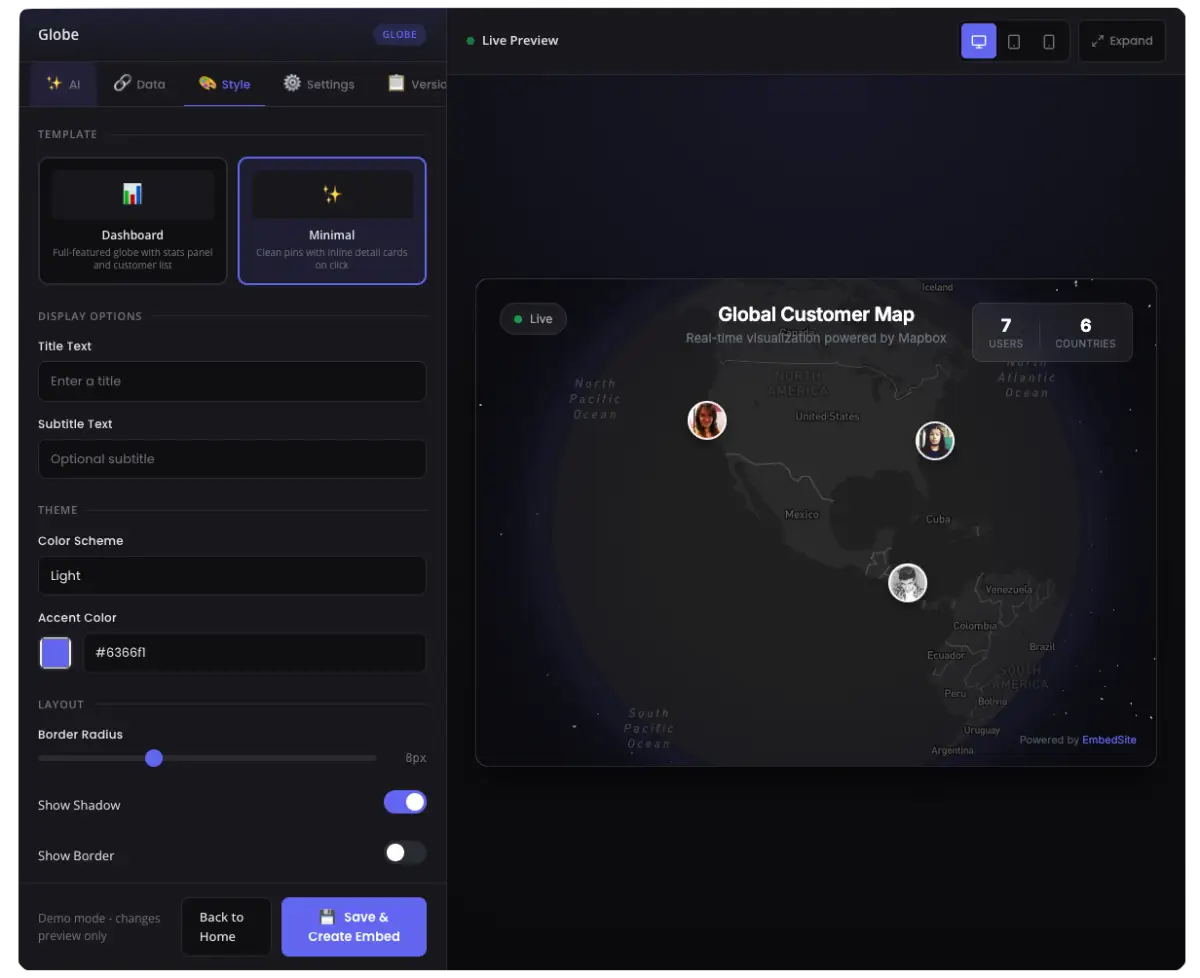
Multiple visualization types: charts, maps, tables, KPI cards, and custom components.
Real-time data syncing when connected sources update.
Responsive embeds that adapt to any screen size automatically.
Simple embed code—one line to add anywhere.
Custom styling and branding to match your site or client needs.
Version control for embeds so updates don't break existing implementations.
Analytics on embedded views and interactions.
Use Cases
Local businesses displaying pricing menus, service packages, or product comparisons that update from a spreadsheet.
Real estate agents showcasing property listings with live updates from their CRM or spreadsheet.
Coaches and consultants embedding pricing tiers, service packages, and testimonial walls.
Event organizers publishing schedules, speaker lineups, or vendor directories that change frequently.
Restaurants and cafes keeping menus, hours, and multiple location info current without touching code.
Online course creators displaying course catalogs, pricing, and student testimonials from Airtable or Sheets.
Membership communities showing member directories, benefits comparison tables, or event calendars.
E-commerce shops adding product comparison tables and review widgets to product pages.