
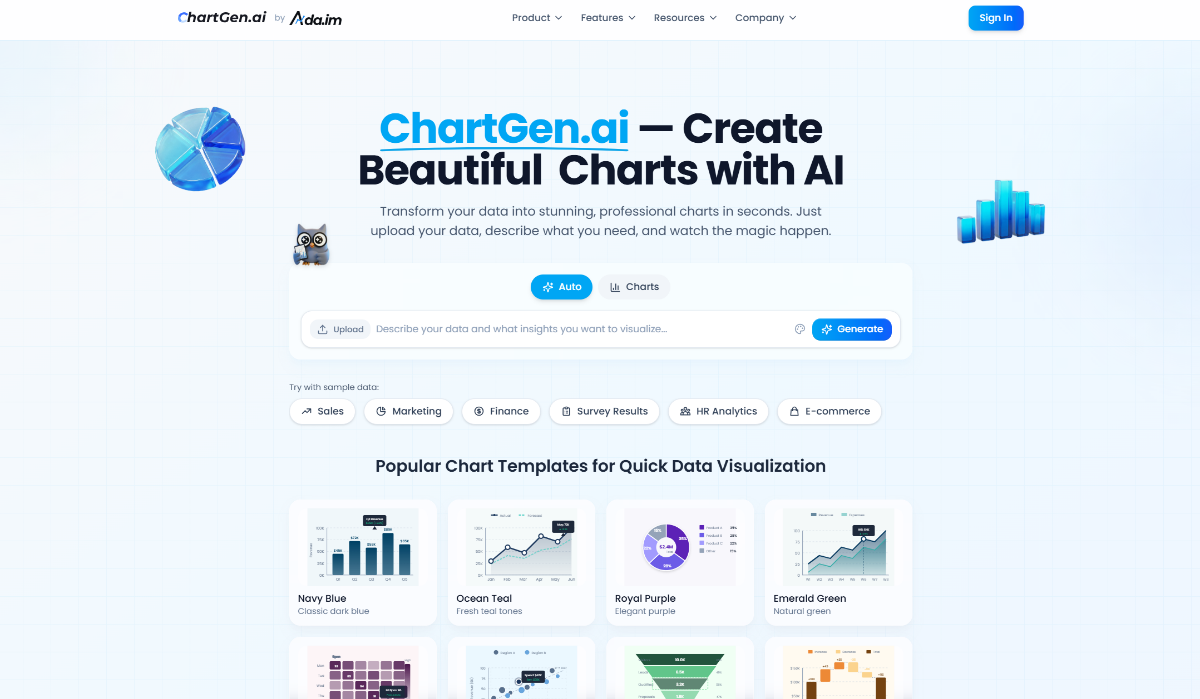
ChartGen.ai: Turn Messy Data into Stunning Charts in Seconds
Stop wrestling with complex spreadsheet formulas. ChartGen.ai is your intelligent visual assistant that transforms raw numbers and text descriptions into publication-ready graphs, diagrams, and dashboards. Just upload your file or ask a question, and let our advanced AI handle the design.
Why Choose ChartGen.ai?
Text-to-Chart Magic
Simply type what you need—'Show me a bar chart of monthly sales growth'—and watch our AI chart generator build it instantly. No coding required.
Instant File Visualization
Upload your CSV or Excel (XLSX). Our engine automatically analyzes the data structure, identifies trends, and suggests the most effective visualization formats.
Powered by Top-Tier AI Models
Leveraging the latest intelligence from GPT-5.2, Claude Sonnet 4.5, and Gemini 3 Pro, ChartGen.ai ensures accurate data interpretation and aesthetically pleasing color palettes every time.
How to Create Charts with AI in 3 Steps
Upload or Describe: Drag and drop your dataset or simply describe the chart you visualize.
AI Analysis: Our algorithms clean your data and select the perfect chart type (Bar, Line, Pie, Scatter, etc.).
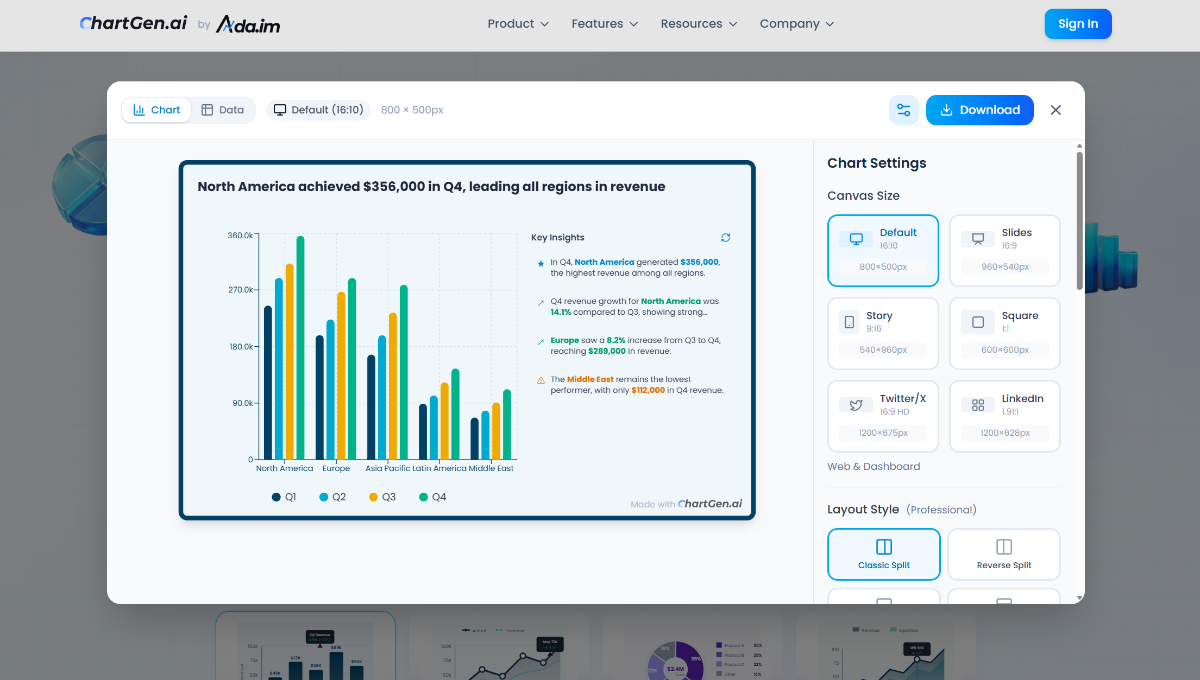
Customize & Export: Tweak colors and labels in real-time, then export as High-Res PNG, SVG, or shareable links.
The Ultimate AI Data Visualization Tool
Whether you are a Business Analyst needing a quick report, a Marketer visualizing campaign ROI, or a Student working on a thesis, ChartGen.ai simplifies the process. Unlike traditional tools like Excel or Tableau, we offer a conversational interface for data.
Ready for deeper insights? ChartGen.ai is just the beginning. As a product of Ada.im, our users can seamlessly upgrade to the full AI Data Analyst experience—complete with predictive analytics, multi-source integration, and team collaboration.